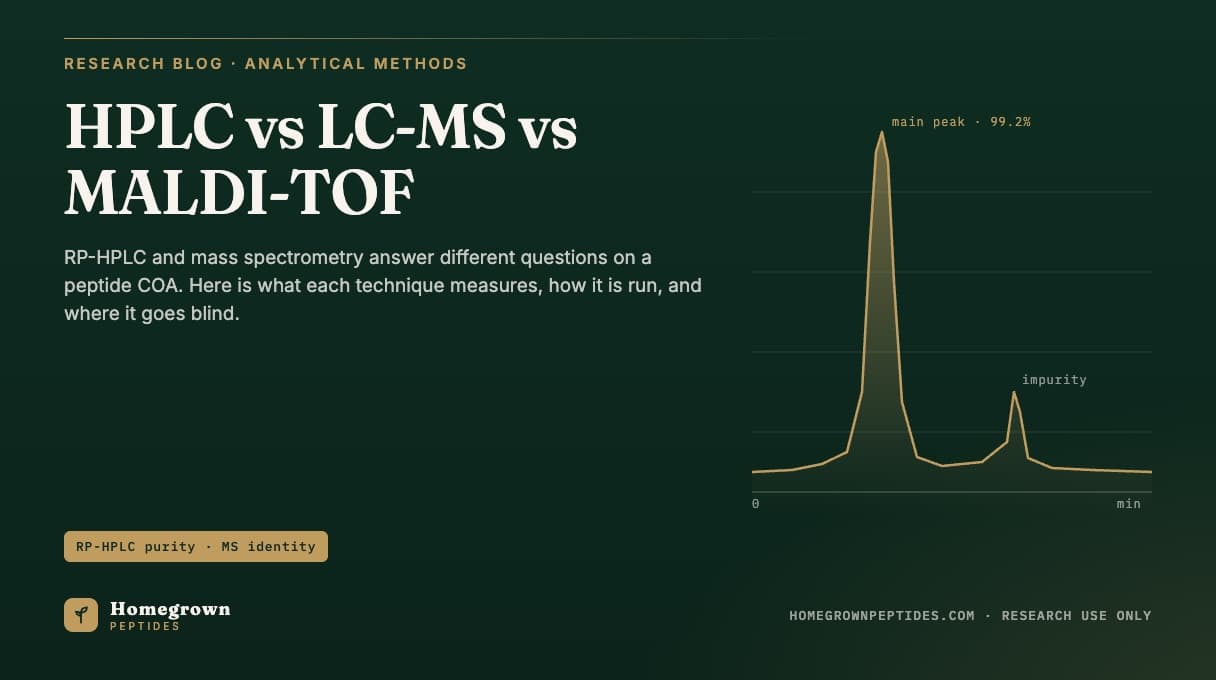
A peptide certificate of analysis reports two separate numbers from two instruments. Reversed-phase HPLC (RP-HPLC) measures purity: area percent of one peak relative to everything else absorbing light at 214 or 220 nm. Mass spectrometry, run as LC-MS or MALDI-TOF, measures identity: whether the observed mass matches the theoretical mass of the intended sequence. Purity asks how clean the sample is; identity asks whether it is the right molecule. A lot can pass one and fail the other, so a well-built COA runs both.
| Technique | Question it answers | Typical result reported |
|---|---|---|
| RP-HPLC (UV 214/220 nm) | How clean is the main peak? | Area percent purity, often 95-99%+ |
| LC-MS (ESI) | Does the observed mass match the sequence? | Deconvoluted mass within a few ppm to 0.01% of theoretical |
| MALDI-TOF | Is the intact mass consistent with the target? | Singly charged [M+H]+ mass, resolution typically in the hundreds to low thousands |
| Amino acid analysis | How much of the vial, by weight, is actual peptide? | Net peptide content, often 70-90% of total mass |
How to read a peptide COA: why HPLC and mass spec don't test the same thing
RP-HPLC separates molecules by hydrophobicity on a C18-bonded silica column against an acetonitrile/water gradient, then measures how much UV light each eluting species absorbs. It has no idea what any peak actually is; it only knows how big each one is relative to the others. Mass spectrometry does the opposite: it ionizes the sample and measures mass-to-charge ratio with no information about overall sample cleanliness, since trace co-eluting species below the detection threshold don't register on the mass spectrum the way they would on a chromatogram. A lot can show 99% HPLC purity with a deamidated impurity sharing nearly the same retention time, and a lot can show a clean mass spec match while sitting at 90% HPLC purity. Reading a COA correctly means checking both lines; see how to read a peptide certificate of analysis for the full checklist.
Why 214 nm or 220 nm for HPLC, and when does 280 nm matter?
Peptide bonds absorb UV light strongly around 214-220 nm because of the amide carbonyl chromophore, so detectors are set there to catch every peptide-bonded species, including impurities that would otherwise be invisible. Detection at 280 nm instead targets the aromatic side chains of tryptophan and tyrosine, useful for peptides containing those residues but blind to short sequences that lack them. A COA that only reports a 280 nm trace for a peptide with no aromatic residues is reporting almost nothing; standard practice for small research peptides is 214 or 220 nm detection, since it does not depend on sequence composition. More on where the area-percent number itself comes from is in HPLC purity explained.
How does column and gradient choice change what the purity number means?
Most peptide purity methods run a C18 column packed with 3-5 micron particles, eluting with a shallow acetonitrile gradient in dilute trifluoroacetic acid, which sharpens peak shape as an ion-pairing agent. A shallow gradient over a longer run resolves closely related impurities, such as a peptide missing one residue, but costs more per lot; a steep gradient runs faster but can merge an impurity into the main peak and inflate the reported purity. Two labs on different gradients or columns can report genuinely different purity numbers without either being wrong, one reason independent verification exists.
How is area percent purity calculated, and where are its blind spots?
Area percent purity is the integrated area under the main peak divided by the total integrated area of every peak in the trace, expressed as a percentage. It says nothing about absolute quantity, only relative proportion among whatever eluted and absorbed UV light in that run. Three categories of material escape this number entirely. An impurity that co-elutes exactly with the main peak is counted as part of it. Counterions such as trifluoroacetate or acetate travel with the peptide as a salt but carry no peptide-bond UV signal, so they stay invisible even though they add real mass to the vial. Residual water from incomplete lyophilization adds weight without appearing on the chromatogram at all. A peptide at 99%+ HPLC purity can still be a smaller fraction of the vial's total weight once counterion and water are counted, the gap net peptide content closes.
How does LC-MS confirm identity: charge states, deconvolution and mass accuracy
Electrospray ionization (ESI), the ion source used in LC-MS, was first demonstrated as a practical way to put large biomolecules into the gas phase intact and measure their mass with high accuracy (Fenn et al., 1989). Because ESI adds multiple protons to a peptide, a single peptide typically produces several peaks at different mass-to-charge ratios, one per charge state, rather than one peak at its true mass. Software deconvolutes those charge-state peaks into a single neutral mass, compared against the theoretical mass calculated from the intended sequence. Early high-resolution mass spectrometry work on peptides established how precisely this comparison can be made, often well under 0.01% of the expected mass for a correctly synthesized peptide (Chait and Kent, 1992). A mass match within tolerance confirms the molecular formula is consistent with the target; it does not by itself prove the sequence order is correct, since two different sequences built from the same residues share the same mass. Sequence confirmation requires fragmentation (MS/MS), covered in mass spectrometry for peptide identity and, for reading the resulting spectrum, in reading a mass spectrum on a peptide COA.
How does MALDI-TOF differ from LC-MS for the same identity question?
MALDI-TOF embeds the sample in a crystalline matrix and fires a pulsed laser at it, ejecting mostly singly charged ions that separate by time-of-flight down a vacuum tube, lighter ions reaching the detector first. Where ESI produces a spread of charge states that must be deconvoluted, standard MALDI produces a simpler spectrum dominated by one [M+H]+ peak, fast for a quick intact-mass check. That simplicity has a cost: conventional MALDI-TOF typically has lower mass resolution and accuracy than high-resolution ESI, and under some conditions can still generate multiply charged ions that complicate the simple-spectrum assumption (Cramer et al., 2013). Because MALDI reads whatever sits in the matrix spot with no prior separation, it is a poor tool for purity and a fast tool for a standalone identity check, which is why some COAs use it as secondary confirmation alongside LC-MS rather than a replacement for it.
| Technique | Typical setup | What it cannot detect | Typical acceptance line |
|---|---|---|---|
| RP-HPLC | C18, 3-5 µm, TFA/acetonitrile gradient, UV 214/220 nm | Co-eluting impurities, counterions, water, non-chromophoric material | Area percent ≥ stated spec, e.g. ≥98% |
| LC-MS (ESI) | Reversed-phase LC inline with ESI source, multiple charge states deconvoluted | Sequence scrambles sharing the same mass; overall sample cleanliness | Observed mass within a stated ppm or Da window of theoretical |
| MALDI-TOF | Crystalline matrix, pulsed laser, mostly singly charged ions, no inline separation | Purity; closely spaced impurities at low resolution | Observed [M+H]+ mass matches theoretical within instrument resolution |
| Amino acid analysis | Acid hydrolysis, ion-exchange or LC separation of free amino acids | Sequence order; non-amino-acid impurities | Net peptide content reported as percent of total weight |
What is net peptide content, and why is it the missing third number?
Net peptide content is the percentage of a vial's total freeze-dried weight that is actually the intended peptide, after subtracting water, residual counterion salt, and non-peptide material. It is typically determined by amino acid analysis, which hydrolyzes the peptide back into free amino acids and quantifies them against calibrated standards, sometimes cross-checked against quantitative NMR (Melanson et al., 2018). This number runs lower than HPLC purity, often 70-90% even on a lot reported at 99% HPLC purity, because the two measure different things: relative cleanliness of the peptide-related peaks versus absolute peptide mass per milligram of powder. A lot-specific example is posted on our BPC-157 lot page; the relationship between the two numbers is worked through in net peptide content vs purity.
What does "99%+ purity" actually mean, and what doesn't it?
A 99%+ HPLC purity result means that, among whatever eluted and absorbed UV light during that run, 99% or more of the integrated peak area belonged to one peak at the expected retention time. It does not mean 99% of the vial's weight is peptide, does not mean every impurity was separated and detected, and does not mean a mass spectrometry identity check was run at all unless the COA shows that result separately. Structurally related impurities, such as a peptide missing a residue, have been shown by paired LC-MS methods to persist even in material reported as highly pure by UV area percent, since some elute close enough to the main peak to go undercounted (Wu et al., 2026). The full breakdown of what 99% purity does and does not guarantee is covered in what does 99% purity mean on a peptide COA.
Frequently asked questions
If a peptide passes LC-MS identity, do I still need the HPLC purity number?
Yes. A correct mass only confirms the molecular formula matches the target; it says nothing about how much of the vial consists of truncated or deamidated impurities with a similar but not identical structure. Purity and identity are independent checks, and a complete COA reports both.
Why do isotope envelopes matter when reading an ESI mass spectrum?
Every element has naturally occurring heavier isotopes, so a peptide's mass spectrum shows a cluster of peaks rather than a single line. The spacing between those peaks reveals the charge state of the ion, and the overall shape helps confirm a peak is genuinely the molecule of interest rather than noise or an unrelated contaminant at a similar mass-to-charge ratio.
Does MALDI-TOF require a chromatography step first?
Not necessarily. MALDI-TOF is often run on a sample spotted directly onto a matrix plate with no inline separation step, which makes it fast but means it cannot report a purity figure the way an HPLC trace can; it answers the identity question only.
What is the difference between monoisotopic mass and average mass on a COA?
Monoisotopic mass uses only the most abundant isotope of each element and is the sharper reference point for small peptides. Average mass accounts for the natural isotopic spread across the whole molecule and is used more for larger peptides where isotope peaks overlap.
Why does a COA sometimes list TFA content as a separate line from purity?
Trifluoroacetate is a counterion left over from reversed-phase purification. It travels with the peptide as a salt, adds measurable weight to the vial, and is reported separately because UV-based area percent purity cannot detect it.
Is a single matching mass enough to prove the amino acid sequence is correct?
No. Two peptides built from the same amino acids in a different order can share an identical total mass. Confirming the actual sequence order requires fragmentation-based mass spectrometry (MS/MS), not an intact mass match alone.
References
- Fenn JB, Mann M, Meng CK, Wong SF, Whitehouse CM. Electrospray ionization for mass spectrometry of large biomolecules. Science. 1989;246(4926):64-71. PubMed 2675315.
- Chait BT, Kent SB. Weighing naked proteins: practical, high-accuracy mass measurement of peptides and proteins. Science. 1992;257(5078):1885-94. PubMed 1411504.
- Mant CT, Kovacs JM, Kim HM, Pollock DD, Hodges RS. Intrinsic amino acid side-chain hydrophilicity/hydrophobicity coefficients determined by reversed-phase high-performance liquid chromatography of model peptides: comparison with other hydrophilicity/hydrophobicity scales. Biopolymers. 2009;92(6):573-95. PubMed 19795449.
- Mant CT, Hodges RS. Design of peptide standards with the same composition and minimal sequence variation to monitor performance/selectivity of reversed-phase matrices. J Chromatogr A. 2012;1230:30-40. PubMed 22326185.
- Cramer R, Pirkl A, Hillenkamp F, Dreisewerd K. Liquid AP-UV-MALDI enables stable ion yields of multiply charged peptide and protein ions for sensitive analysis by mass spectrometry. Angew Chem Int Ed Engl. 2013;52(8):2364-7. PubMed 23341077.
- Melanson JE, Thibeault MP, Stocks BB, Leek DM, McRae G, Meija J. Purity assignment for peptide certified reference materials by combining qNMR and LC-MS/MS amino acid analysis results: application to angiotensin II. Anal Bioanal Chem. 2018;410(26):6719-6731. PubMed 30143839.
- Wu P, Cheng Y, Li D, Tan H, Li J, Zhang D. Comparison of structurally related impurity profiles in teriparatide from synthetic and recombinant DNA origin using liquid chromatography-high resolution mass spectrometry. Rapid Commun Mass Spectrom. 2026;40(17):e70125. PubMed 42312586.
- Lyutvinskiy Y, Nagornov KO, Kozhinov AN, et al. Adding color to mass spectra of biopolymers: charge determination analysis (CHARDA) assigns charge state to every ion peak. J Am Soc Mass Spectrom. 2024;35(5):902-911. PubMed 38609335.
Research use only. Homegrown Peptides products are for laboratory research and are not for human or animal use. Nothing in this article is medical advice.