A "99% purity" figure on a peptide certificate of analysis (COA) is almost always an HPLC area percent: the area under the main peak in a reversed-phase chromatogram, expressed as a share of the total peak area detected at a given ultraviolet wavelength. It is a real, useful number, but it is a narrower measurement than the phrase "99% pure" suggests to most readers, and it is not the same figure as net peptide content by weight. Two lots that both report 99% purity on their COAs can differ in exactly what makes up the other 1%, in how completely the assay separates closely related impurities, and in how much of the vial's dry weight is actually peptide once water and counterion are accounted for. This article walks through how to read the number as a buyer of research material rather than accept it at face value alone.
| Attribute | Detail |
|---|---|
| What "99% purity" usually measures | HPLC area percent: the main peak's share of total integrated peak area on a reversed-phase UV chromatogram |
| Common method | Reversed-phase HPLC (RP-HPLC) with UV detection, increasingly paired with LC-MS for peak identity and co-elution checks |
| What it does not measure directly | Net peptide content by weight, residual water, and counterion (commonly trifluoroacetate) content |
| What the remaining "1%" typically is | Truncated or deletion sequences, diastereomers (epimers), and oxidized or deamidated variants from synthesis |
| Where the number lives | The lot-specific COA, not the product label, and it applies only to that lot |
What does the HPLC purity number actually measure?
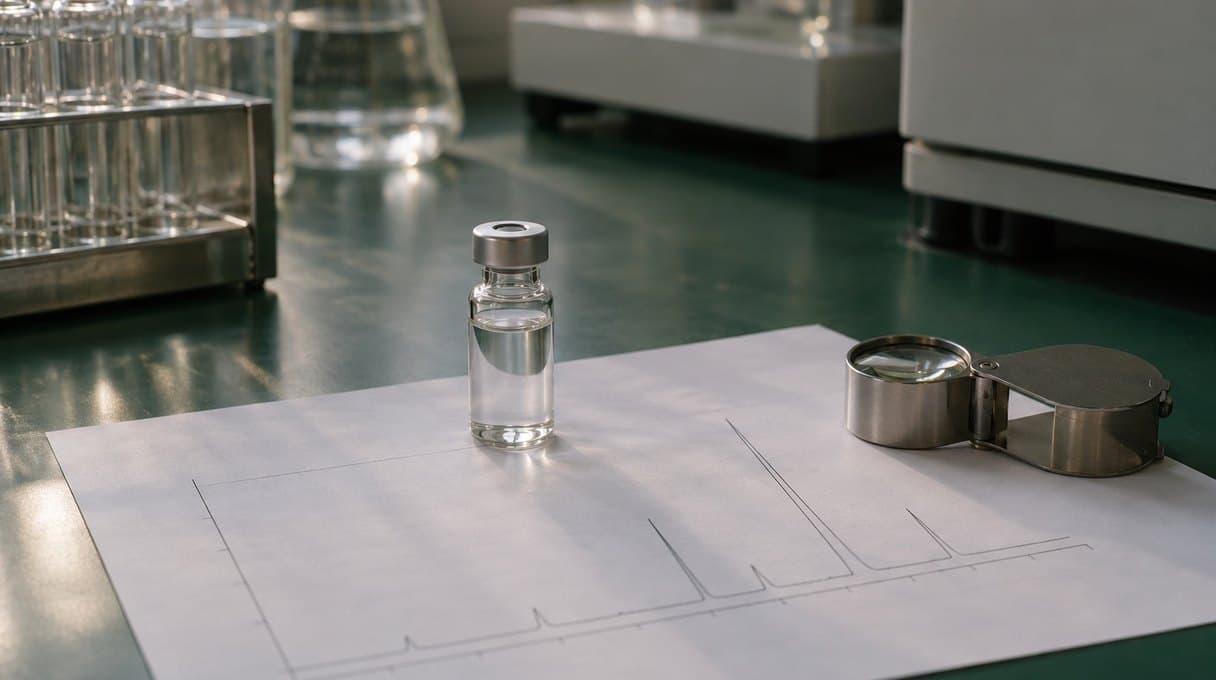
In a typical reversed-phase HPLC purity assay, a small amount of dissolved peptide is passed through a column and separated into peaks based on how each component interacts with the stationary and mobile phases. A UV detector then records the area under every peak that elutes. The reported "purity" is the area of the main, target peptide peak divided by the sum of all detected peak areas, expressed as a percentage. Our guide on HPLC purity explained covers the chromatography side of this measurement in more depth, including why detection wavelength and column choice affect what gets counted. The short version relevant here is that the number is a ratio of peak areas on one instrument run, not a direct count of molecules or a measurement of mass.
Area percent vs weight percent: why "99% pure" is not "99% peptide by weight"
Area percent purity and net peptide content answer different questions. Area percent asks: of everything detected in the chromatogram, what fraction is the main peak? Net peptide content asks: of the total dry weight in the vial, what fraction is actual peptide, once water, residual solvent, and counterion salts such as trifluoroacetate are subtracted? A lyophilized powder can show 99% area purity on its HPLC trace and still be substantially less than 99% peptide by weight, because water content and counterion mass are not peaks on that chromatogram at all; they are measured by separate tests such as loss-on-drying and ion chromatography or mass spectrometry-based counterion analysis. Our companion article on net peptide content vs purity works through that distinction with worked numbers. The practical point for reading a COA is to check whether it reports purity, net peptide content, or both, since "99%" attached only to the first does not tell you the peptide fraction of the mass in the vial.
Why can two vials both say 99% and still be different?
Two labs analyzing the same nominal peptide can report the same area-percent figure while the underlying chromatography tells different stories, for a few reasons documented in the analytical chemistry literature on peptide purity assessment. First, method selectivity matters: closely related impurities, such as a peptide missing one amino acid or containing a single epimerized residue, can co-elute with the main peak under one gradient and separate cleanly under another, so the reported area percent depends on how well the method resolves near-neighbor structures rather than on the sample alone (Cheung et al., 2022). Second, detector wavelength and peak-purity assessment differ between labs; a UV trace that looks like one clean peak can still contain a co-eluting minor component, which is part of why analytical groups have developed two-dimensional liquid chromatography coupled to mass spectrometry specifically to check whether an apparently pure peak is homogeneous (Petersson et al., 2023; Stoll et al., 2023). A vial's true impurity profile only becomes clear when the method used to generate the number is understood, which is one reason a COA that names the method (column type, gradient, wavelength) is more informative than one that states a bare percentage.
What is usually in that remaining 1%?
For a well-made synthetic peptide, the small remaining fraction on an HPLC trace is typically made up of process-related impurities rather than unrelated contamination. Solid-phase peptide synthesis can generate truncated sequences (where a coupling step failed and the chain is shorter than intended), deletion peptides missing an internal residue, and diastereomers or epimers, where a single amino acid's chirality was inverted during synthesis or storage. A recent review of enantiomeric purity in synthetic therapeutic peptides summarizes how these chiral impurities arise during coupling and racemization-prone steps and why they are difficult to fully separate from the target sequence by standard reversed-phase methods alone (Badgujar et al., 2024). Oxidized or deamidated variants, arising from side-chain chemistry rather than synthesis errors, round out the typical impurity picture; these are the same degradation pathways covered from a storage-stability angle in our article on how peptides degrade.
What role does mass spectrometry play alongside the purity number?
Because a single HPLC-UV peak can, in principle, contain more than one co-eluting species, laboratories increasingly pair the area-percent assay with liquid chromatography-mass spectrometry (LC-MS) to confirm both identity (does the mass match the expected sequence) and homogeneity (is the peak a single species). A review of LC-MS approaches to synthetic peptide therapeutics lays out the current landscape of methods used for this kind of characterization, along with the practical challenges of applying them consistently across peptide classes (Lian et al., 2021). A COA that reports both an HPLC purity percentage and a confirmatory mass spectrum for identity gives a buyer more assurance than a percentage number alone, because the mass spectrum addresses a failure mode (a co-eluting impurity with a similar retention time but a different mass) that the area-percent number cannot catch by itself.
How does counterion content fit into the purity picture?
Most synthetic peptides are supplied as a salt, commonly a trifluoroacetate (TFA) salt left over from the reversed-phase purification step itself, and that counterion contributes real mass to the lyophilized powder without being "impurity" in the chromatographic sense. A recent methods paper on analyzing and, where needed, exchanging TFA counterion content in synthetic peptides describes how this mass fraction is measured separately from HPLC purity and why it matters for anyone trying to reconcile a purity percentage with an expected peptide weight in a vial (Erckes et al., 2025). This is part of why a single "99%" figure, without a stated net peptide content or counterion assay, leaves out information that a buyer weighing out material for a study would want.
Where to check this on a real lot
The only way to answer these questions for a specific vial is to read that lot's own COA rather than a general product description. As one example of the kind of lot-specific documentation to look for, our BPC-157 lot page links a current certificate of analysis stating the HPLC method and purity result for that lot; the same reading approach applies to any peptide COA regardless of which compound it covers.
Frequently asked questions
Is a higher purity percentage always better for research use?
Higher area-percent purity generally indicates fewer detectable process impurities, which is useful for reproducibility. However, the percentage should be read alongside the stated method (column, gradient, detection wavelength) and, when available, a net peptide content figure, since two numbers reported under different methods are not always directly comparable.
Does 99% purity mean 99% of the vial's weight is peptide?
No. The purity percentage is typically an HPLC area percent, a chromatographic ratio, not a measurement of the dry weight fraction that is peptide. Net peptide content, measured separately, accounts for water and counterion mass and is usually lower than the area-percent purity figure.
Why do labs use area percent instead of a direct mass measurement for purity?
HPLC area percent is fast, sensitive, and works on small sample amounts, making it practical for routine lot release testing. Direct mass-based measurements of peptide content, such as quantitative amino acid analysis, are more labor-intensive and are typically run separately when net peptide content is reported.
What should I look for on a COA beyond the bare purity percentage?
Look for the analytical method used (column, gradient, detection wavelength), a confirmatory mass spectrum for identity, and, if available, a net peptide content or counterion figure. A COA that names its methods is more informative than one reporting a percentage alone.
Can two peptides both marked 99% pure differ in research outcomes?
They can differ in what makes up the small remaining fraction, such as which specific impurity species are present, which is why understanding the analytical method behind the number matters when comparing lots or vendors rather than relying on the percentage alone.
References
- Cheung MY, Bruce J, Euerby MR, Field JK, Petersson P. Investigation into reversed-phase chromatography peptide separation systems part V: Establishment of a screening strategy for development of methods for assessment of pharmaceutical peptides' purity. J Chromatogr A. 2022;1668:462888. PubMed 35231862.
- Petersson P, Buckenmaier S, Euerby MR, Stoll DR. A strategy for assessing peak purity of pharmaceutical peptides in reversed-phase chromatography methods using two-dimensional liquid chromatography coupled to mass spectrometry. Part I: Selection of columns and mobile phases. J Chromatogr A. 2023;1693:463874. PubMed 36841023.
- Stoll DR, Sylvester M, Euerby MR, Buckenmaier SMC, Petersson P. A strategy for assessing peak purity of pharmaceutical peptides in reversed-phase chromatography methods using two-dimensional liquid chromatography coupled to mass spectrometry. Part II: Development of second-dimension gradient conditions. J Chromatogr A. 2023;1693:463873. PubMed 36871316.
- Lian Z, Wang N, Tian Y, Huang L. Characterization of Synthetic Peptide Therapeutics Using Liquid Chromatography-Mass Spectrometry: Challenges, Solutions, Pitfalls, and Future Perspectives. J Am Soc Mass Spectrom. 2021;32(8):1852-1860. PubMed 34110145.
- Badgujar D, Paritala ST, Matre S, Sharma N. Enantiomeric purity of synthetic therapeutic peptides: A review. Chirality. 2024;36(3). PubMed 38448043.
- Erckes V, Streuli A, Chamera Rendueles L, Krämer SD, Steuer C. Towards a Consensus for the Analysis and Exchange of TFA as a Counterion in Synthetic Peptides and Its Influence on Membrane Permeation. Pharmaceuticals (Basel). 2025;18(8). PubMed 40872554.
Research use only. Homegrown Peptides products are for laboratory research and are not for human or animal use. Nothing in this article is medical advice.