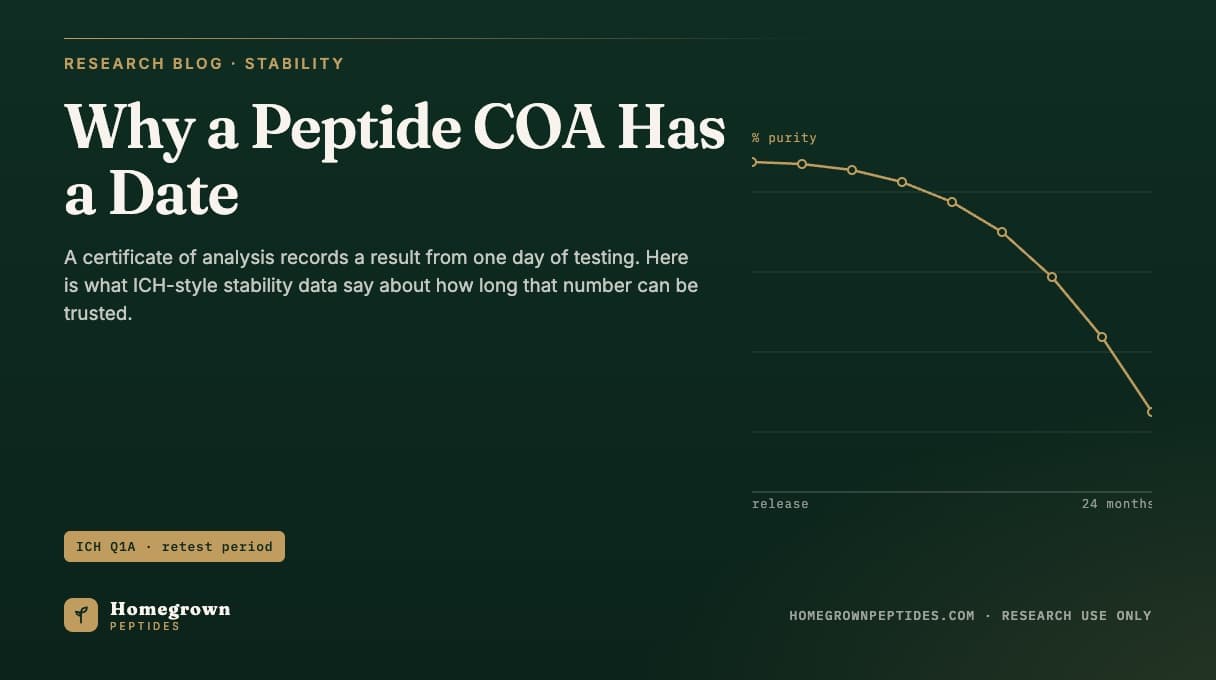
A certificate of analysis carries a date because the purity figure on it describes one sample, analyzed on one instrument, on that day. Purity is not fixed onto a lot forever; it drifts with time, temperature, moisture and light through a small set of pathways, oxidation, deamidation, hydrolysis and aggregation, each leaving a specific mass signature on HPLC and LC-MS. ICH-style stability programs measure that drift under defined storage conditions and define how long a storage-matched result can be trusted. That window, not the number itself, is what a retest date or expiration date on a lot actually encodes.
| Attribute | Detail |
|---|---|
| What a COA date represents | Day of analysis and lot release, not a forward guarantee of later purity |
| Oxytocin degradation activation energy, pH 4.5 | 116.3 kJ/mol, from RP-HPLC loss of intact peptide at 40-80°C |
| Deamidation mass shift (Asn or Gln side chain) | +0.98 Da per site, indistinguishable from plain hydrolysis by mass alone |
| Oxidation mass shift (Met, Trp or Cys) | +16 Da per oxidized residue, +32 Da for a second oxidation |
| Buffer-peptide adduct formation (oxytocin in citrate) | Detectable after 3 months at room temperature in the dark, greatest at pH 4-4.5 |
What does the date on a peptide COA actually mean?
The date marks when a lab ran an assay, typically HPLC for purity and LC-MS for identity, on a specific vial or batch sample. It is not a prediction about that sample's condition a month or a year later. A release COA is generated close to manufacture, when degradation products sit at their lowest level and the chromatogram is closest to ideal. Everything after that date depends on storage and elapsed time, exactly what a stability program measures. For the layout of a typical COA, see how to read a peptide certificate of analysis; this article goes further into why that number has a shelf life of its own.
What are ICH Q1A storage conditions, and what do they mean for a lyophilized peptide?
ICH Q1A(R2) defines the storage conditions and minimum testing durations behind a retest or expiration date. Long-term testing runs at the labeled condition; intermediate is a fallback used only if accelerated data show meaningful change; accelerated testing uses elevated temperature and humidity to generate the same degradation faster, a risk-flagging tool, not a substitute for long-term data. Lyophilized peptide hormones labeled for refrigerated storage are commonly studied on a parallel scheme, long-term at 5°C ± 3°C and accelerated at 25°C ± 2°C / 60% RH ± 5%.
| Study type | Storage condition | Minimum data period | What it establishes |
|---|---|---|---|
| Long-term, general case | 25°C ± 2°C / 60% RH ± 5% | 12 months, to proposed dating period | Retest or expiration date, ambient storage |
| Long-term, hot/humid zones III-IV | 30°C ± 2°C / 65% RH ± 5% | 12 months | Dating period for warmer climates |
| Intermediate | 30°C ± 2°C / 65% RH ± 5% | 6 months | Used only if accelerated data show change |
| Accelerated | 40°C ± 2°C / 75% RH ± 5% | 6 months | Estimates kinetics, flags unstable lots early |
| Refrigerated long-term | 5°C ± 3°C | 12 months | Dating period for most lyophilized hormones |
| Refrigerated accelerated | 25°C ± 2°C / 60% RH ± 5% | 6 months | Estimates risk from a cold-chain excursion |
What do real-time and accelerated stability studies actually show for peptides?
Accelerated testing works because deamidation, oxidation and hydrolysis follow rate kinetics that speed up at higher temperature, usually describable with the Arrhenius equation. Hawe and colleagues measured this directly for oxytocin, a small cyclic nonapeptide, running accelerated degradation at 40, 55, 70 and 80°C across four pH conditions; loss of intact peptide by RP-HPLC followed first-order kinetics at every pH, with an activation energy of 116.3 kJ/mol at pH 4.5, the most stable condition tested (Hawe et al., 2009). Nguyen and colleagues compared oxytocin ampoules labeled for 2 to 8°C against ones labeled for ≤25°C, running accelerated stability at 30, 40 and 50°C for up to 120 days plus temperature-cycling for up to 135 days. The two labeling categories degraded comparably overall, with one ≤25°C-labeled product degrading faster at 50°C and no meaningful loss during refrigerated cycling (Nguyen et al., 2019). Accelerated data rank risk quickly, but a dating period ultimately rests on long-term data at the condition the product is actually stored under.
What chemical changes actually show up as new HPLC peaks over time?
A handful of pathways account for almost every new peak that appears as a peptide ages past release, each with a distinct mass signature LC-MS can resolve even when retention time alone cannot (Manning et al., 2010).
Oxidation
Methionine, tryptophan and cysteine are the most oxidation-prone residues. A single oxidation event adds 16 Da, visible as a new, usually earlier-eluting peak since the oxidized form is more polar; a second oxidation adds another 16 Da (Manning et al., 2010).
Deamidation
Asparagine and glutamine side-chain amides hydrolyze to aspartate or glutamate, or isomerize to isoAsp or isoGlu via a cyclic succinimide intermediate, adding a net 0.98 Da, close enough to plain hydrolysis that mass alone cannot distinguish them; identifying the isomer requires tandem mass spectrometry with diagnostic fragments (Riggs et al., 2019). The full four-step kinetic pathway, including the succinimide intermediate and its pH dependence, has recently been resolved on a model dipeptide by combined NMR, IR and computational methods (De Sciscio et al., 2026). Deamidation rates can also be predicted from local structure before a real-time study finishes, making this pathway one of the easier ones to flag early (Gamage et al., 2019).
Hydrolysis and buffer adducts
The buffer a peptide sits in can also react with it directly. Oxytocin in citrate buffer forms covalent amide- and imide-linked adducts at the peptide's N-terminal cysteine amine, a reaction absent in acetate or phosphate buffers; these were detectable after three months at room temperature in the dark, greatest between pH 4 and 4.5 (Poole et al., 2011). A new peak on reanalysis is not always intrinsic peptide chemistry; it can be the formulation matrix reacting with the peptide over time.
Aggregation
Disulfide scrambling, dityrosine cross-linking and non-covalent self-association show up as new species at different pH and temperature. In the same oxytocin work, tri- and tetrasulfide forms plus disulfide- and dityrosine-linked dimers appeared at pH 4.5, 7.0 and 9.0 (Hawe et al., 2009). On a purity trace, aggregates typically appear as new, earlier-eluting reverse-phase peaks or increased high-molecular-weight signal on size-exclusion chromatography, distinct from the monomer peak the COA was built from.
What is the difference between a retest date and an expiration date?
A retest date is the point by which a bulk active must be re-analyzed before further use; it does not mean the material is unusable after that date, only that its quality can no longer be assumed from the original COA. An expiration date is a harder boundary for a finished product: the material should not be used past that point at all, derived from long-term data extrapolated conservatively, not a trend line read as far as it will go. Lyophilized peptide actives sold for further lab use are generally retest-date candidates, since what happens to them afterward is still undetermined at sale. Either date is only meaningful for material stored near the labeled condition; it is not a warranty against a deviating storage history.
How do moisture ingress and light exposure change the degradation kinetics?
Residual moisture in a lyophilized cake is not something to minimize as far as possible. Work on lyophilized recombinant proteins found that both under-dried and over-dried powder lost biological stability faster under temperature stress than powder held near the calculated monolayer water content, an optimum rather than a monotonic dryness-stability relationship (Hsu et al., 1992). Deamidation and hydrolysis especially need mobile water to proceed at an appreciable rate, so a compromised seal or freezer-door condensation can raise local water activity above what the original study assumed, pushing the real rate above what the labeled dating period predicts. Light is separate: aromatic and sulfur-containing residues are photolabile, and formal programs test photostability apart from thermal and humidity stability so the two are not conflated. A lot kept cold but left under ambient light is not tracking the curve its date was built from.
Why can a reanalysis of an old lot legitimately differ from the release COA?
A different number on a later assay is not evidence the original COA was wrong; it is the expected output of the same chemistry the program measures, applied under actual, not labeled, storage conditions. Two lots released at the same purity can show different reanalysis results months later if one spent more time outside its labeled range or saw more freeze-thaw, light or humidity exposure than the other. Both numbers can be correct for the day each was measured; the gap is the real-world version of the drift long-term and accelerated studies model on paper. For the chemistry behind that drift, see how peptides degrade.
How does a lab read a dated COA against its own storage history?
A COA date is only useful alongside a record of what happened to the vial afterward: date received, date moved into long-term storage, and every excursion to room temperature for weighing or aliquoting. Treat the labeled storage condition as an assumption to verify, not a guarantee, especially near the edge of a lot's stability-supported window. For a quantitative assay, rerunning HPLC or LC-MS on the specific vial in hand is the only way to know its current state. General guidance on how long a given format holds up is in how long do lyophilized peptides last. For an example of what a release COA records, see a current lot page such as our BPC-157 lot, and check its test date against your own freezer log before relying on the printed figure.
Frequently asked questions
Is a COA's purity number still accurate a year after the date on it?
Only if the material was stored near the labeled condition that whole year and the stability program supports a dating period at least that long. Purity drifts through oxidation, deamidation, hydrolysis and aggregation at rates set by temperature, moisture and light, so a number printed a year earlier is a starting point, not a current reading.
What is the practical difference between a retest date and an expiration date?
A retest date means the material must be re-analyzed before further use past that point; an expiration date means it should not be used past that point at all, regardless of testing. Bulk peptide actives for further laboratory use typically carry retest-style thinking even when not formally labeled that way.
Does refrigeration stop peptide degradation completely?
No. Refrigeration slows the chemistry substantially but does not stop it; long-term studies for refrigerated biologics still run a year or more at the labeled cold condition because measurable change still occurs, just more slowly.
Why do accelerated stability studies use high temperatures instead of just waiting?
A study at the labeled condition for the full dating period is still what sets that period. Accelerated conditions speed up the same chemistry so risk can be flagged in months rather than years, a prediction, not a replacement for long-term data.
References
- Manning MC, Chou DK, Murphy BM, et al. Stability of protein pharmaceuticals: an update. Pharm Res. 2010;27(4):544-575. PubMed 20143256.
- Hawe A, Poole R, Romeijn S, et al. Towards heat-stable oxytocin formulations: analysis of degradation kinetics and identification of degradation products. Pharm Res. 2009;26(7):1679-1688. PubMed 19343484.
- Nguyen TH, Lambert P, Minhas RS, et al. Temperature stability of oxytocin ampoules labelled for storage at 2°C-8°C and below 25°C: an observational assessment under controlled accelerated and temperature cycling conditions. BMJ Open. 2019;9(7):e029083. PubMed 31350247.
- Poole RA, Kasper PT, Jiskoot W. Formation of amide- and imide-linked degradation products between the peptide drug oxytocin and citrate in citrate-buffered formulations. J Pharm Sci. 2011;100(7):3018-3022. PubMed 21547912.
- Riggs DL, Silzel JW, Lyon YA, et al. Analysis of glutamine deamidation: products, pathways, and kinetics. Anal Chem. 2019;91(20):13032-13038. PubMed 31498611.
- De Sciscio ML, Mosetti R, D'Arco A, et al. A combined experimental-theoretical approach unveils the comprehensive Asn deamidation kinetics. J Am Chem Soc. 2026;148(31):33727-33734. PubMed 42584574.
- Gamage CLD, Hageman TS, Weis DD. Rapid prediction of deamidation rates of proteins to assess their long-term stability using hydrogen exchange-mass spectrometry. J Pharm Sci. 2019;108(6):1964-1972. PubMed 30684538.
- Hsu CC, Ward CA, Pearlman R, et al. Determining the optimum residual moisture in lyophilized protein pharmaceuticals. Dev Biol Stand. 1992;74:255-271. PubMed 1592175.
Research use only. Homegrown Peptides products are for laboratory research and are not for human or animal use. Nothing in this article is medical advice.